NOTE: The goal of this article is not to diagnose serious sleep problems. If you suspect medical sleep disorders, you should consult the person's doctor and undergo a thorough medical examination.
It is easiest to interpret hypnograms for people you know well. If you know the person's age, gender, activity level, and other characteristics, it is much easier to interpret what you see in a sleep analysis.
Before we begin, it is important to point out that interpreting a hypnogram is a bit like reading a weather forecast: there are many different graphs to consider, and you have to try to keep an eye out for things that don't seem right. Like the weather forecast, hypnograms do not always have a good correlation with how the person behaves the day after a sleep analysis. But it is also important to remember that Somnofy and Guardian H10 are very accurate measuring tools: you can trust the movement graph and breathing curve 100%.
A good night's sleep
The first hypnogram we will look at is a good night's sleep that received 98 sleep points. The person went to bed at 9:00 p.m. to sleep and fell asleep one hour later. They slept for a total of 9 hours without major awakenings and with very little restlessness during the night.
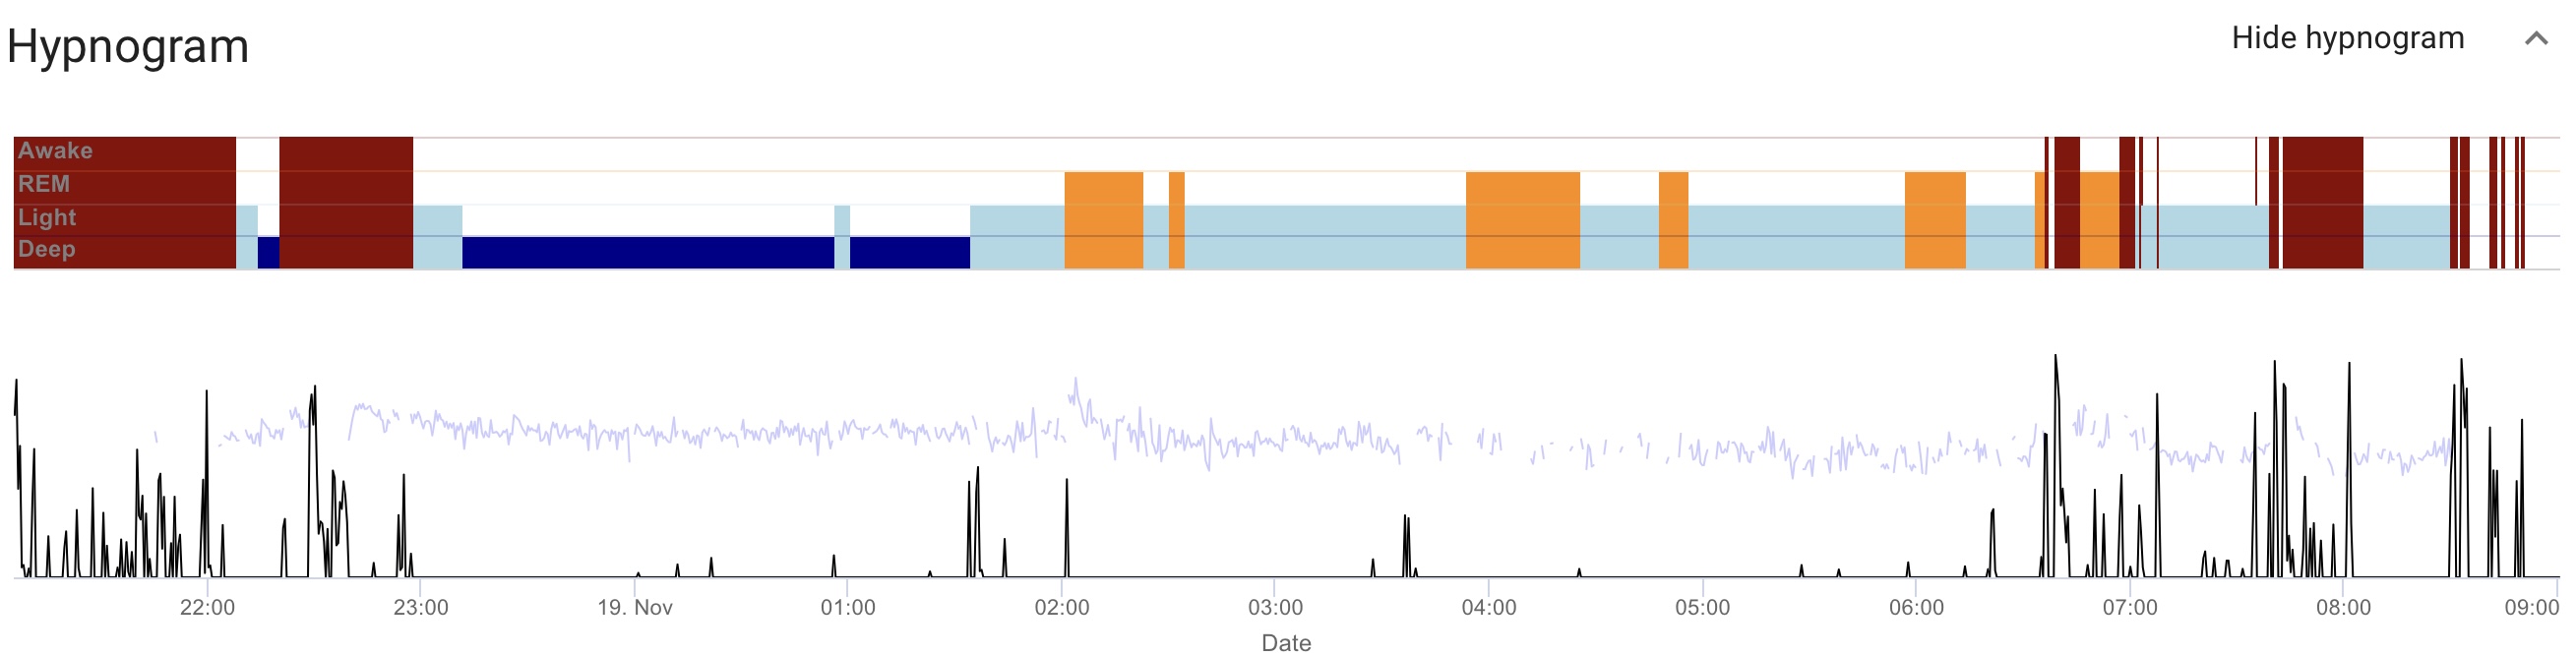
We see a large continuous deep sleep phase right after falling asleep and several REM phases distributed throughout the night. From just before 7:00 a.m., the person wakes up several times. This may indicate that they have had enough sleep at that point and can actually get up.
The breathing rate is captured clearly throughout the night, thanks to the low level of movement.
More good sleep
This example displays a sleep analysis typical for a user at a health facility for healthy older adults. It shows patterns of very long nights with some awakenings. This individual had a good night.
It is easy to see from the pie chart that there is much more REM sleep than recommended (20-25% is optimal). This often occurs when people sleep much longer than the recommended 8-9 hours for adults, as REM phases occur later in the night.
We see a total sleep time of 11 hours and 48 minutes, but also with high sleep efficiency.
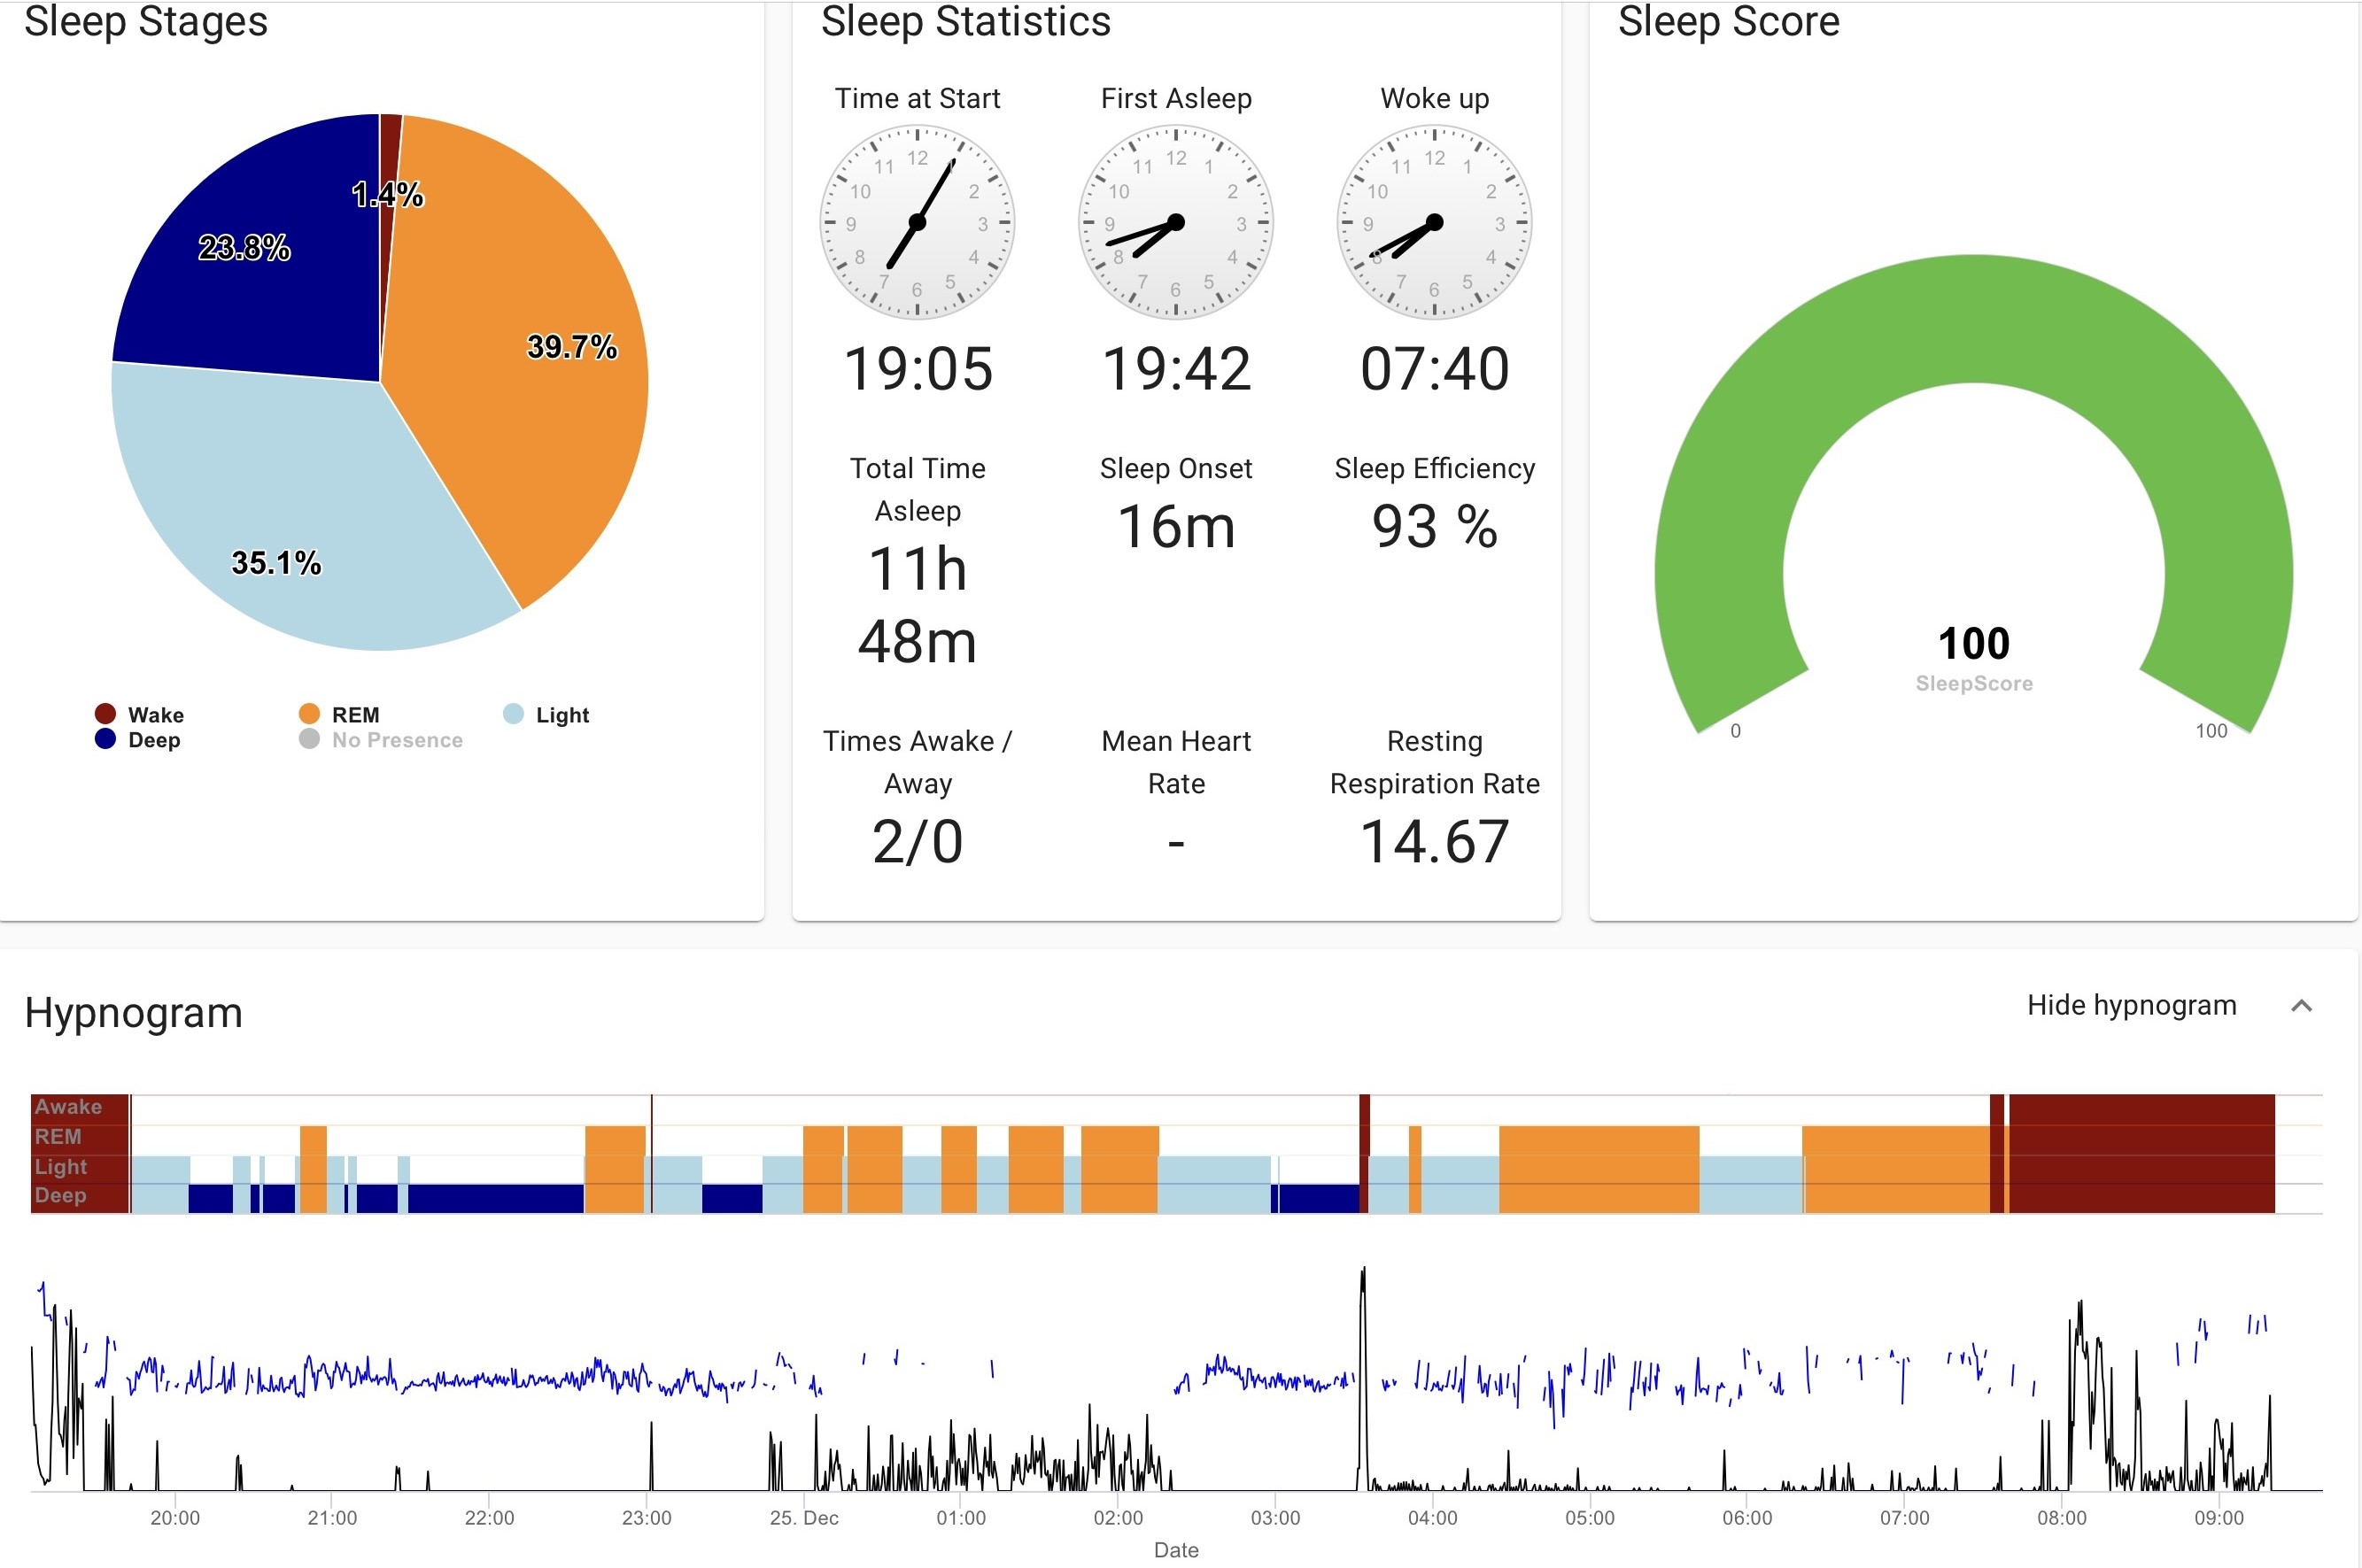
The graphs below the hypnogram show movement (black) and breathing rate (blue). There is a somewhat restless period between 00:00 and 02:00 with several REM phases and more movement. Otherwise, this sleep is of very good quality, deserving 100 sleep points. We see long deep sleep phases at the beginning of the night and another one after 03:00.
Many awakenings
From the two examples of good sleep, we now move on to more mixed sleep analyses that require careful examination to determine whether the sleep was "enough" or whether the person should be treated even more carefully the next day.
In such cases, subjective perception of sleep quality can be very far from what is objectively measured by the device, so it is particularly important to maintain a respectful and explanatory tone when discussing the sleep analysis with the person.
At first glance, we see a lot of wakefulness in the pie chart below. However, 85 sleep points with a yellow-green color are not too bad. The sleep statistics tell us about 8 hours and 19 minutes of sleep time, which is very good, but also a sleep efficiency of only 70%, which indicates a lot of wakefulness during the night. The device also counts the number of awakenings and how many times the person got up. The person got up 4 times - which could be a sign of a restless night or frequent urination.
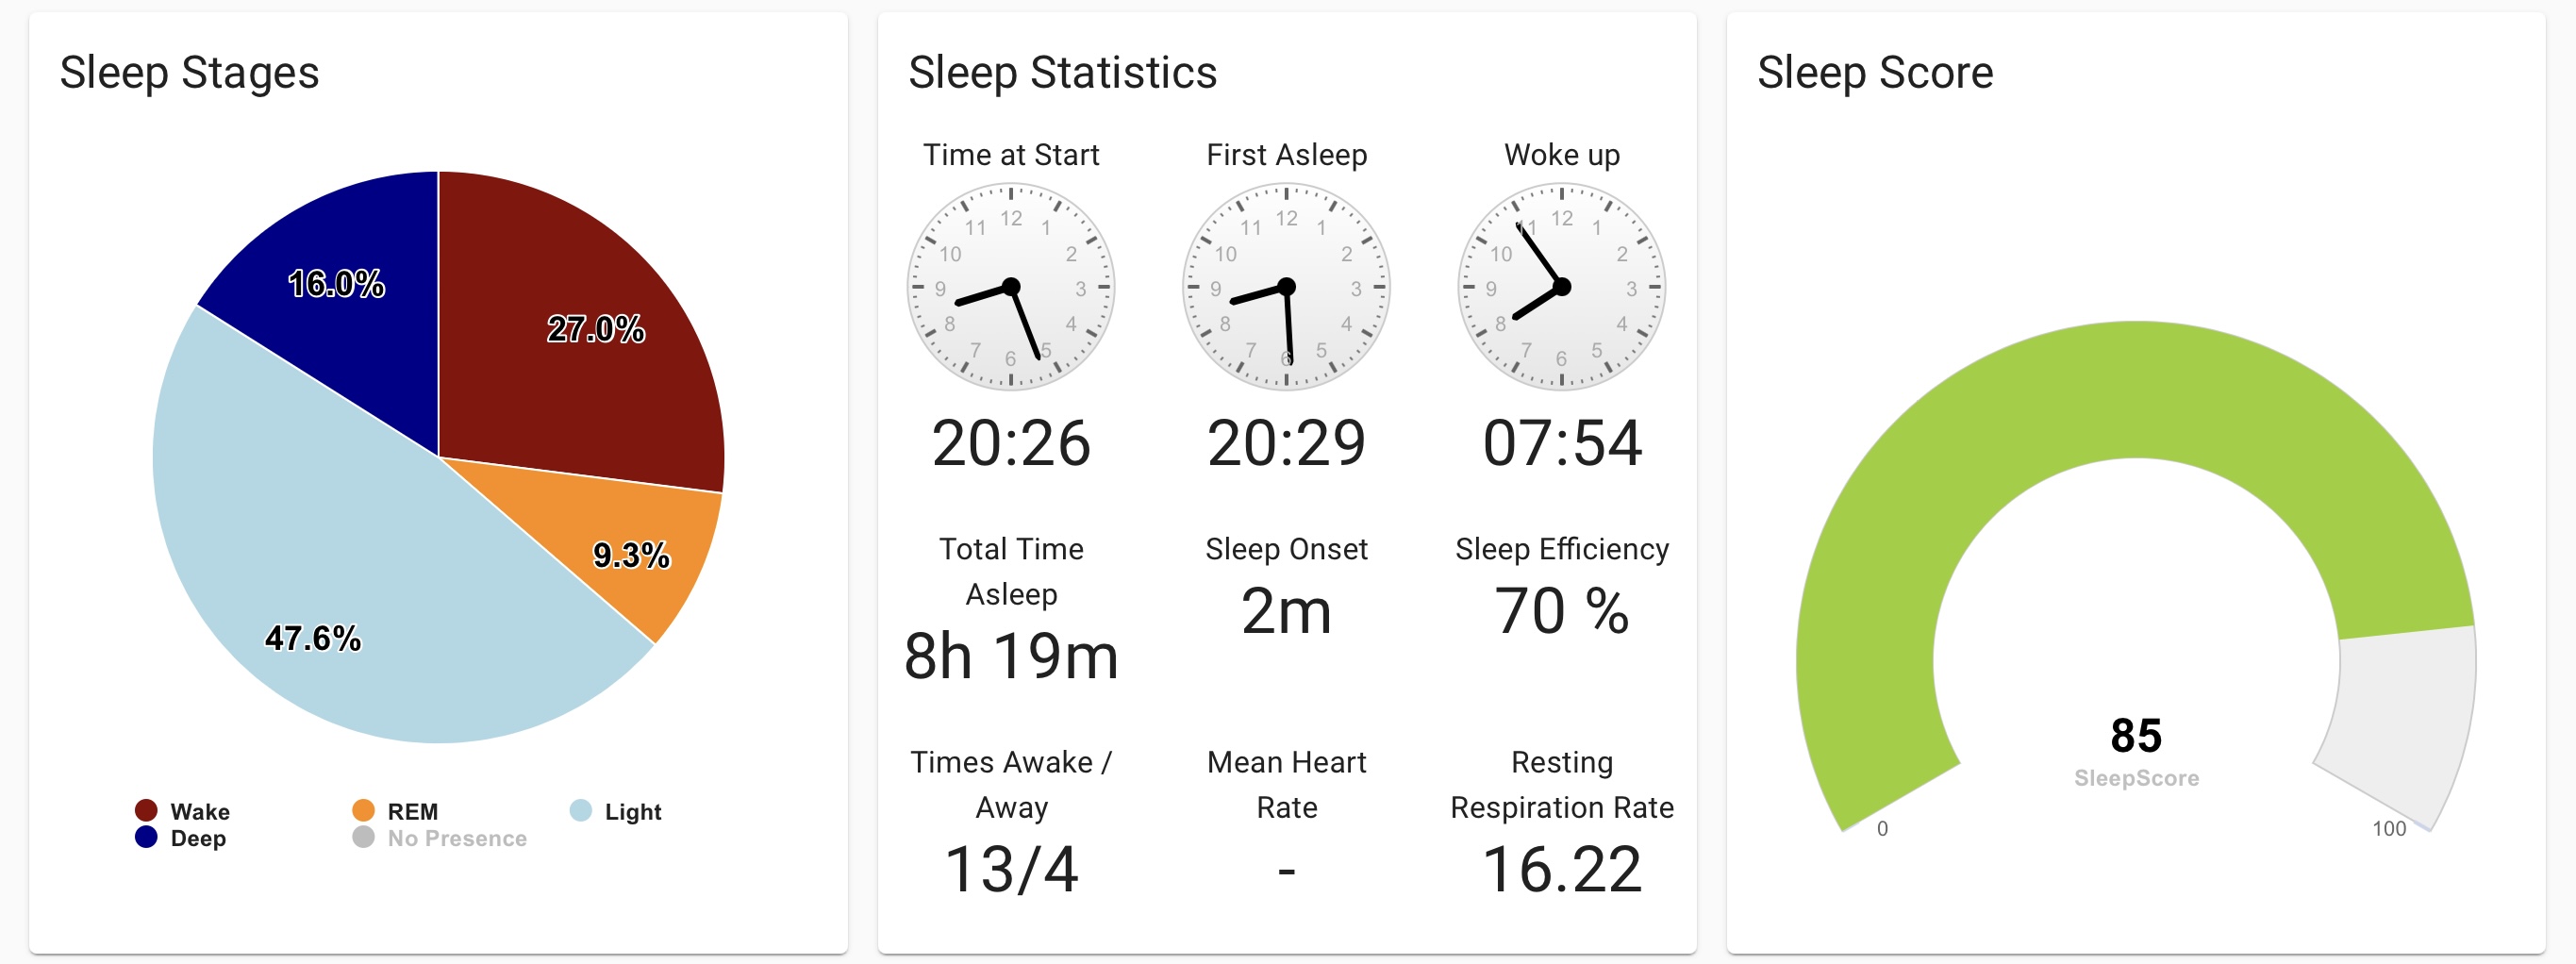 But before a thorough analysis of the hypnogram, we cannot accurately determine how the night has been. We see many red bars scattered throughout the night, but also a relatively good amount of deep sleep in between the wake-ups. Nevertheless, it becomes clear that the person is not going to remember this night as particularly good. The long wake-ups are what will stick in their memory, and there is a risk that the person will claim not to have slept a single second.
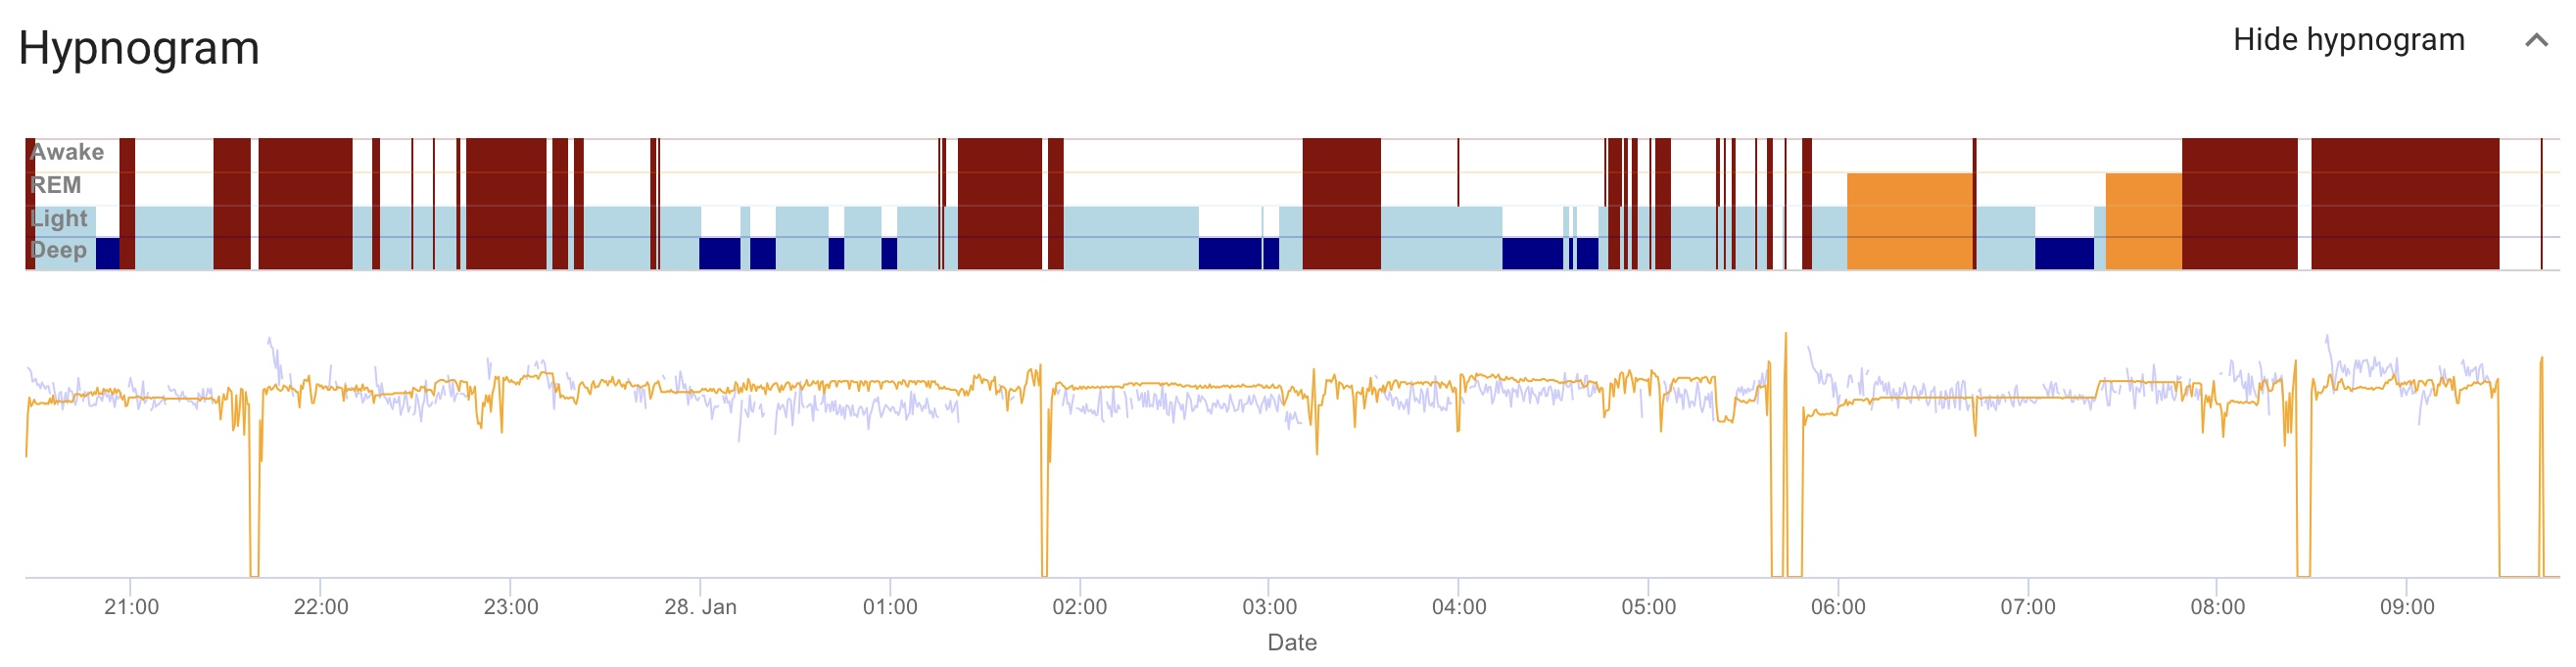 The four awakenings counted by the device can be seen in the yellow graph selected right below the hypnogram. It shows distance. The distance from the device on the wall to the chest is quite stable except for four instances where it suddenly drops to 0. This is the pattern that is shown when the person leaves the measurement area that the device is set up to monitor.
If you notice that the distance jumps down to 0 more frequently than what could be true, it's possible that the distance in the app is set too short. You can adjust the distance as described here.
A Restless Night
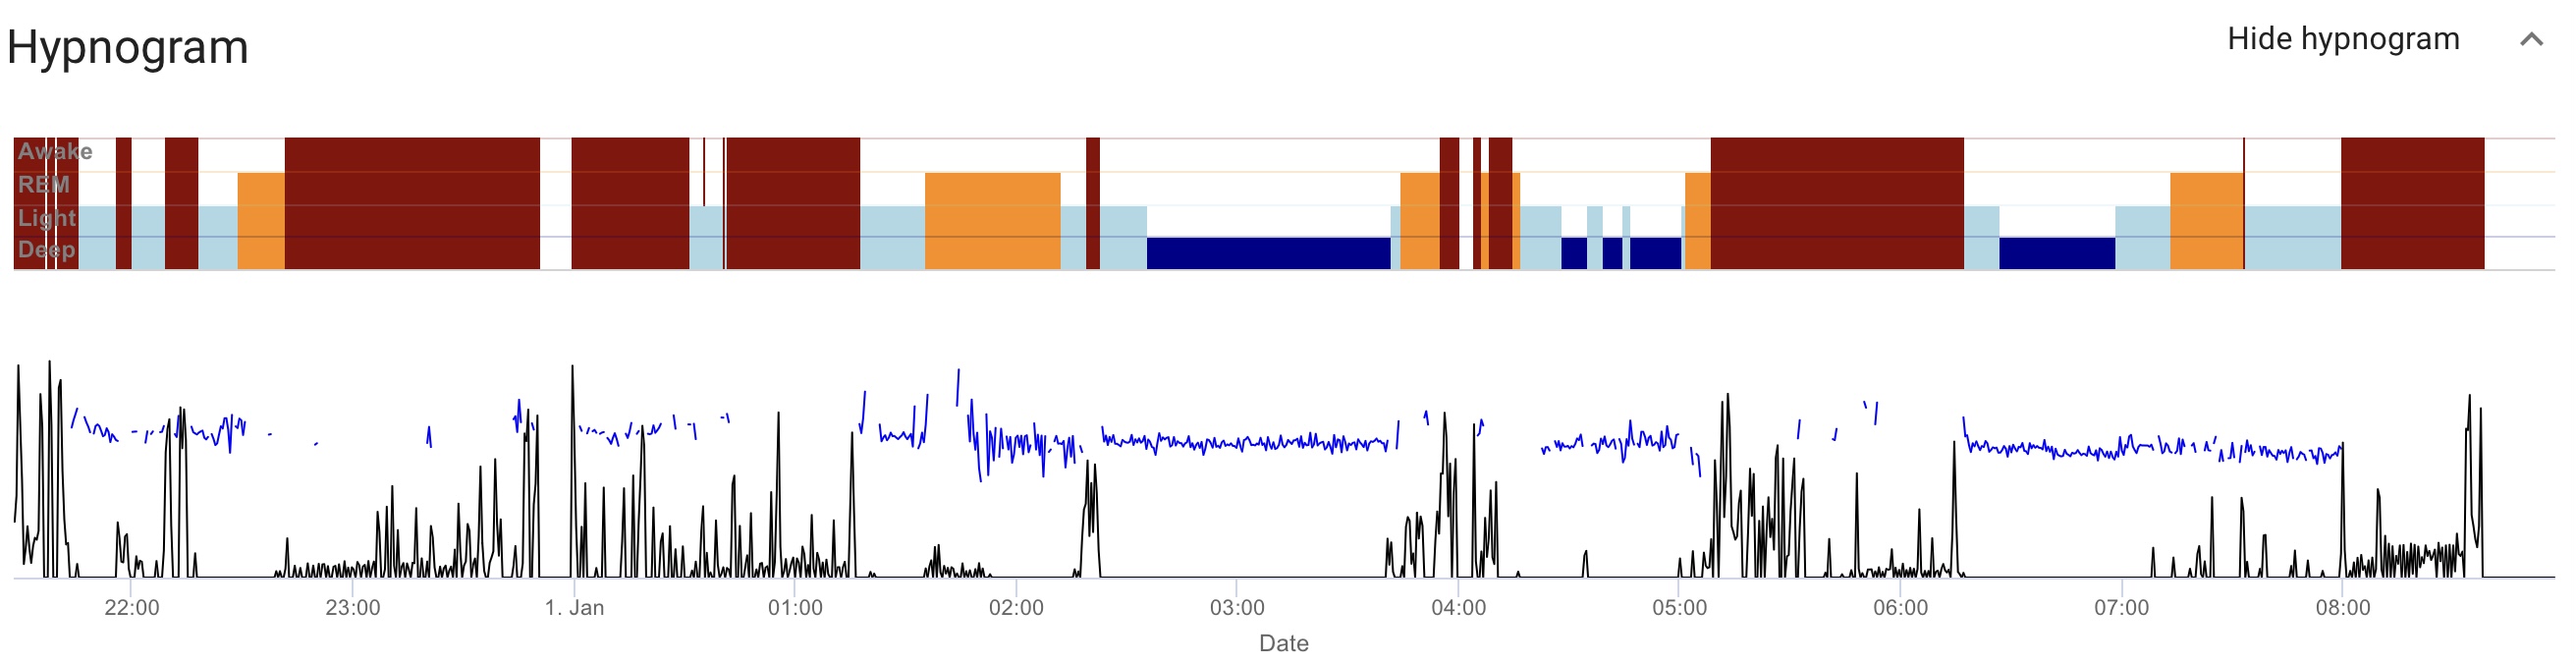
The following example shows a very restless night with many awakenings and a lot of movement. We see a hypnogram with many red bars and little continuous sleep. Especially the period from 9:30 pm to after 1 am is stressful and uncomfortable for the person. A short awakening at 4 am could be a bathroom visit, while 1 hour of wakefulness between 5:15 and 6:15 indicates a lot of physical restlessness.
Very little sleep
And then we come to an example that shows a really bad night for the person. A lot of wakefulness in the cake diagram, red color and only 68 sleep points, a total sleep time of 6 hours and a low sleep efficiency - everything points to this night being bad.
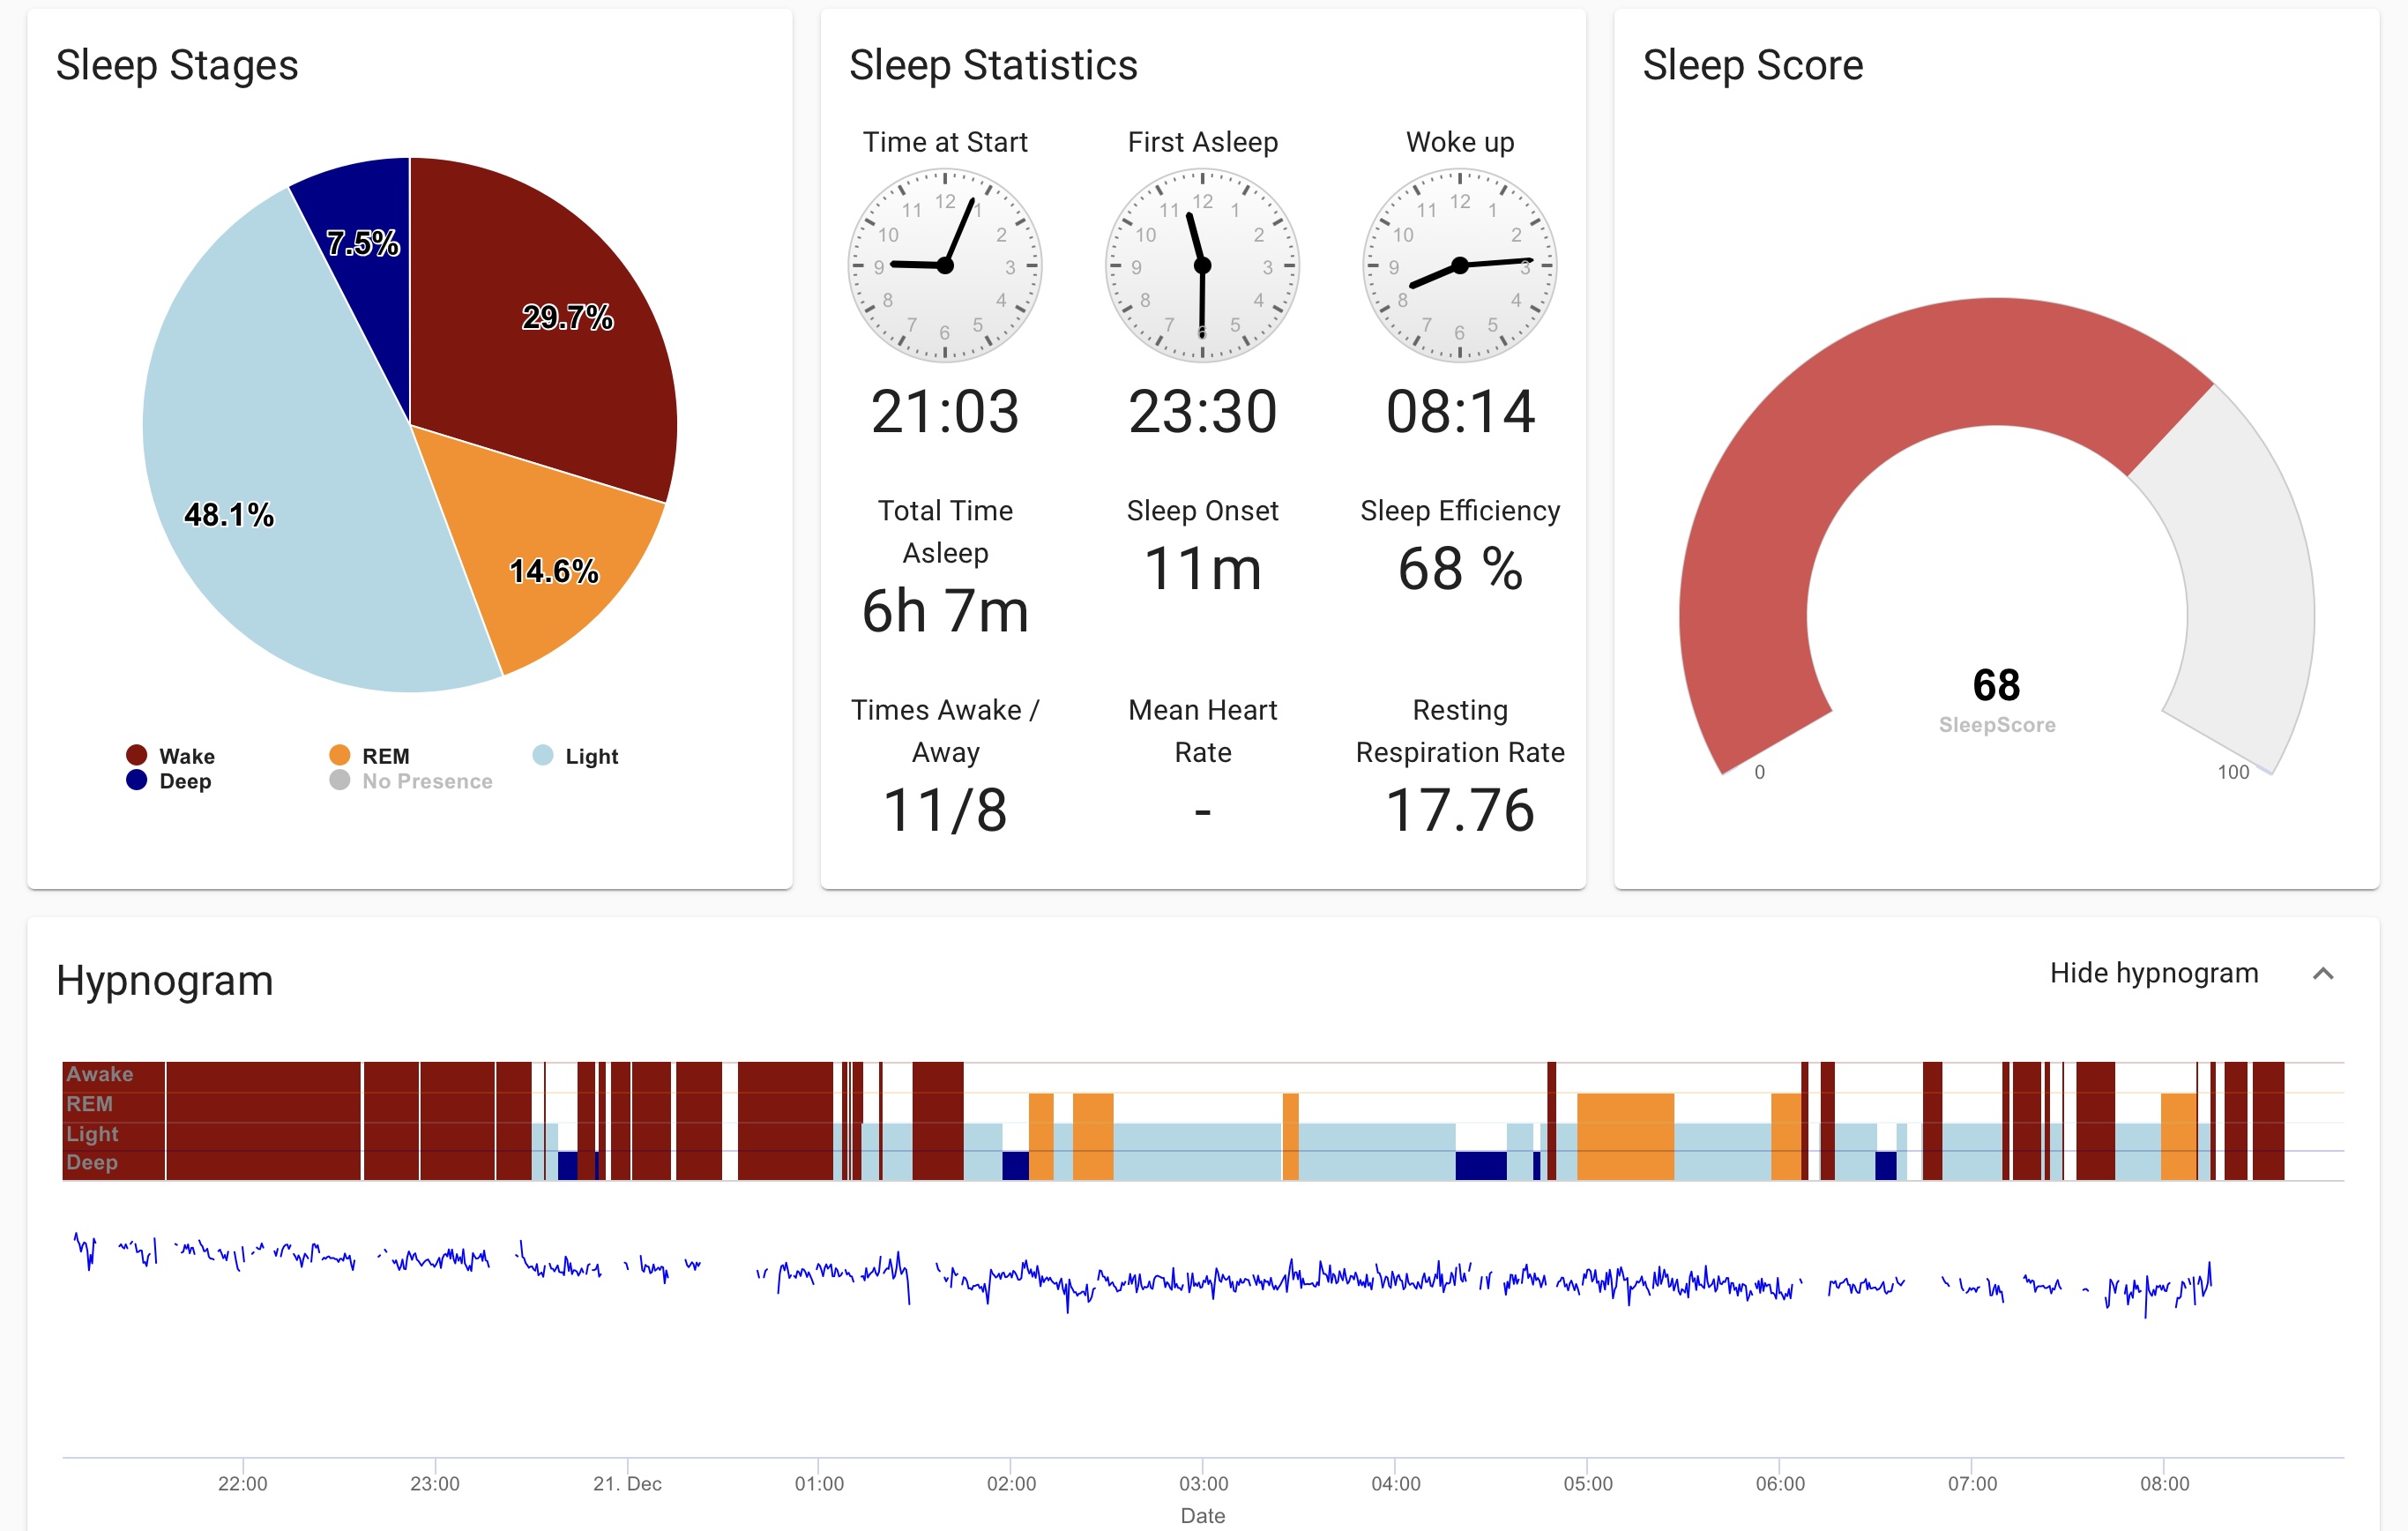
The hypnogram confirms this. The initial sleep onset period lasted from 21:00 to 23:30, but the short sleep then was interrupted after a short period. The first continuous sleep period is seen from 01:45 to 06:15, but the end of the night is also fragmented.
This person is likely not well-rested in the morning and should focus on getting enough sleep the following night.
The sleep analyses provided are meant to be examples of how to interpret a hypnogram from the device. They are not necessarily representative of all sleep analyses, and the sleep analysis you receive from your institution may look quite different. It's important to discuss your specific sleep analysis with a healthcare professional if you have any concerns or questions.